Group 2. The environmental and resource productivity of the economy
This group of indicators explores whether Moldova is becoming more efficient in its use of natural resources and environmental services. It measures nine indicators of environmental and resource productivity: greenhouse gases, carbon productivity, final consumption of energy, energy intensity, share of renewable energy in the final consumption of energy, waste generation and recycling, and use of fertilisers and water. In this way, the indicators capture the efficiency with which economic activities – both production and consumption – use energy, other natural resources and environmental services. They reflect key aspects of the transition to a low-carbon, resource-efficient economy: carbon and energy productivity, resource productivity and multifactor productivity.
Indicator 2.1 Greenhouse gases
Key message
The increase in GHG emissions has major implications for the environment and increases vulnerability to climate change. The increase in GHG emissions led to temperature rise, degradation of climatic conditions and more frequent and intense extreme weather events. In Moldova, GHG emissions, including CO2 – which accounted for two-thirds of emissions – have been relatively stable since 2010.
Indicator trend
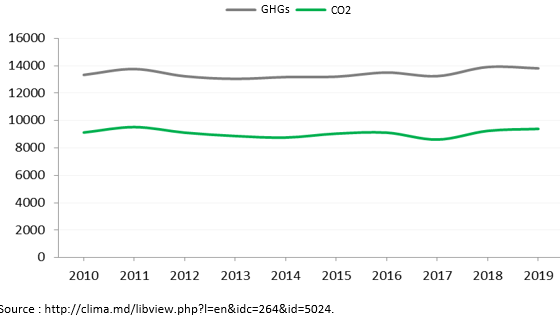
Between 2010 and 2019, the rate of GHG emissions was relatively stable (figure 15). During this period, there were annual emissions of about 13.4 million tonnes of CO2-equivalent (CO2-eq). Annual trends have fluctuated around this value, ranging between 13-13.8 million tonnes of CO2-eq. CO2 represents two-thirds of emissions. Between 2010 and 2019, CO2 emissions have fluctuated between 8.8 9.5 million tonnes with an annual average value of about 9.1 million tonnes.
Figure 15. Greenhouse gas emissions, including CO2 (thousand tonnes of CO2-equivalent)
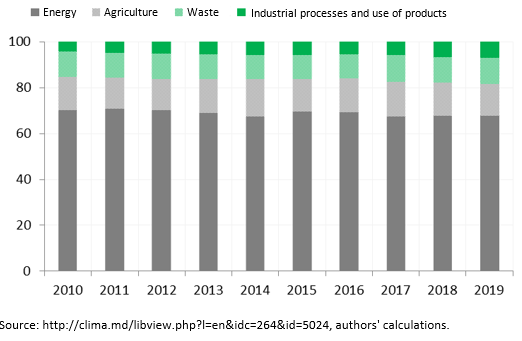
Between 2010 and 2019, the structure of GHG emissions, depending on the sector, did not change significantly (figure 16). The share of emissions generated by the energy sector, for example, decreased from 70% to 67.5%. Meanwhile, the agricultural sector produced about 14.5% of emissions and waste produced at least 11%. The share of emissions from industrial processes and use of products increased from 4.2% to 7.2%.
Figure 16. Structure of greenhouse gas emissions by sector (percentage)
Indicator 2.2 Carbon productivity
Key message
Carbon productivity reflects the correlation between CO2 emissions and economic dynamics. Productivity is determined by the value of economic output (MDL or USD of GDP) per a certain quantity of CO2. For example, higher productivity means production of 1 MDL or USD of GDP is accompanied by a reduction of CO2 emissions.
In Moldova, a relatively constant volume of GHG emissions, including CO2, has been accompanied by GDP growth since 2010. As a result, carbon productivity increased and economic growth decoupled from CO2 emissions. Despite this increase, carbon productivity in Moldova is still low compared with other European countries.
Indicator trend
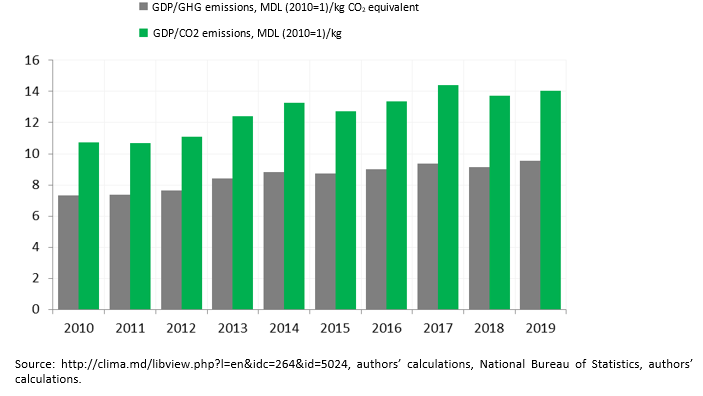
Between 2010 and 2019, the economy of Moldova began to rise, although GDP decreased in 2012 and 2015. As a result, GDP grew by about 42% between 2010-19. The constant volume of CO2 emissions combined with GDP growth resulted in higher carbon productivity (figure 17). Productivity grew from 7.3 to 9.5 MDL/kg. At the same time, the ratio between GDP and GHG emissions increased from 10.7 to 14.0 MDL/kg CO2-eq. Higher carbon productivity shows that economic growth decoupled from CO2 emissions.
Figure 17. GHGs and carbon productivity in Moldova
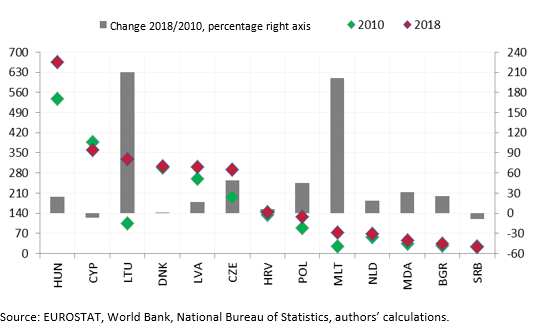
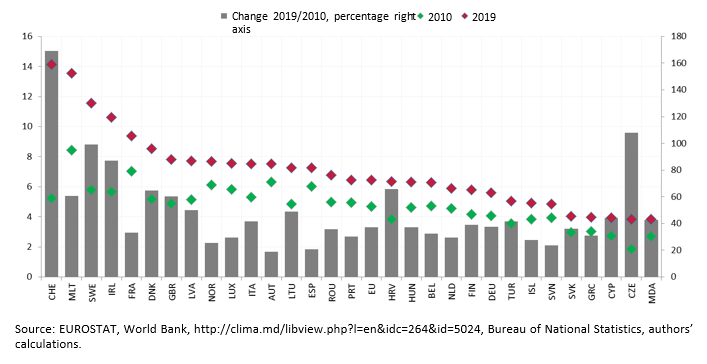
Carbon productivity expressed in USD at purchasing power parity (PPP) in constant 2017 prices grew from USD 3.0 to 4.0 PPP/kg between 2010 and 2019, an increase of 30.8%. Although this is positive, productivity in Moldova grew at a lower rate than in the European Union (35.5%). Hence, although productivity in Moldova grew by over 30%, it is still low compared with other European countries (figure 18). Moreover, Moldova ranks at the bottom of European countries in terms of carbon productivity. Thus, in 2016, productivity in Moldova accounted for 58.4% of the EU level.
Figure 18. Carbon productivity, USD PPP (2017=1)/kg
Indicator 2.3 Final consumption of energy
Key message
The way energy is used has an impact on the development of the green economy. Producing energy with less fuel generates fewer CO2 emissions and helps maintain a clean environment. Energy productivity reflects the relationship between the use of energy and economic growth. Productivity is determined by the value of economic output (1 MDL or USD of GDP) per a certain quantity of energy. For example, growth in productivity reveals that production of 1 MDL or USD of GDP was accompanied by a decrease in energy consumption. In Moldova, the supply of primary energy and final consumption of energy increased after 2020. Energy supply grew at a lower rate than GDP. As a result, energy productivity increased. Nonetheless, this growth did not allow Moldova to improve its position in relation to other European countries.
Indicator trend
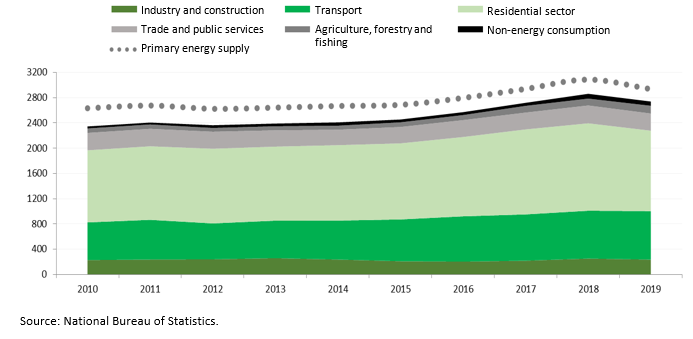
After 2010, the supply of primary energy increased (except for a decrease in 2019). Between 2010 and 2019, the supply of primary energy grew from 2.6 to 2.9 million tonnes of oil equivalent (toe), an increase of 11.5%. The increasing supply of energy was determined by the growth in consumption. Thus, in 2019, compared with 2010, final consumption of energy grew by 16.8%, from 2.3 to 2.7 million toe.
During 2010 and 2019, non-energy consumption triggered the fastest growth in energy use, from 32 000 to 67 000 toe. Energy consumption in agriculture also grew quickly: from 71 000 to 123 000 toe (73.2%). Meanwhile, energy use in the transport sector grew from 597 to 769 million toe (28.8%). The residential sector grew at a slower pace: from 1.1 to about 1.3 million toe (11.6%). Energy consumption in industry and construction, as well as in the trade and public service sector, remained generally stable. The use of energy in industry and constructions varied around the level of 230 000 toe. Meanwhile, in the trade and public service sector, consumption oscillated around the level of 270 000 toe.
Figure 19. Supply of primary energy and final consumption of energy by sectors (thousand tonnes oil equivalent)
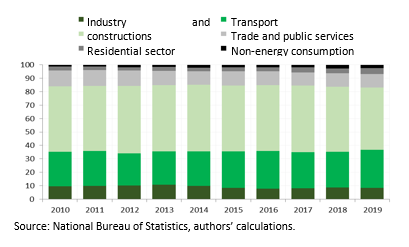
Between 2010 and 2019, the structure of final consumption of energy underwent minor changes. The share of the residential sector in energy consumption decreased from 48.6% to 46.5%, while the share of transport increased from 25.5% to 28.1%. The share of energy consumption also decreased in industry and construction (from 9.7% to 8.5%) and in trade and public services (11.8% to 9.9%). The share of energy use increased in agriculture (from 3.0% to 4.5%) as did the share of non-energy consumption (from 1.4% to 2.4%). However, the sector still accounts for a small share of energy consumption.
Figure 20. Structure of final consumption of energy (percentage)
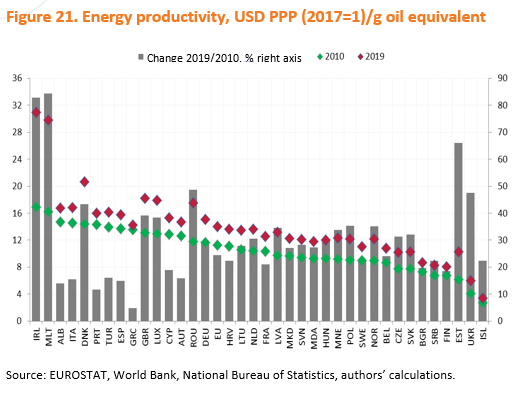
Between 2010 and 2019, the supply of primary energy increased by 11.5%, and GDP grew by about 42%. As a result, energy productivity increased and economic growth decoupled from energy use. In terms of economic output at PPP, the level of productivity grew by 27.2% – from 9.2 to 11.8 USD/kg.
Energy productivity grew much faster in Moldova compared with other European countries. For example, between 2010 and 2019, productivity in the European Union grew by 24.4% and was 2.7 percentage points lower than growth in Moldova. Despite this progress, productivity in Moldova is still low compared with other European countries. Among European countries, Moldova ranks near the bottom in terms of energy productivity (figure 21).
Figure 21. Energy productivity, USD PPP (2017=1)/g oil equivalent
Indicator 2.4 Energy intensity
Key message
Energy intensity is the opposite of energy productivity. Energy intensity is determined by the quantity of consumed energy per one value unit of economic output (1 MDL or USD of GDP or GVA). A lower intensity shows that reduction in energy use was accompanied by production of the same level of GDP or even output growth.
A lower intensity or higher energy productivity shows that economic growth is accompanied by a more efficient use of energy resources. In Moldova, productivity grew and energy intensity decreased after 2010. Nonetheless, energy intensity did not diminish in all economic sectors.
Indicator trend
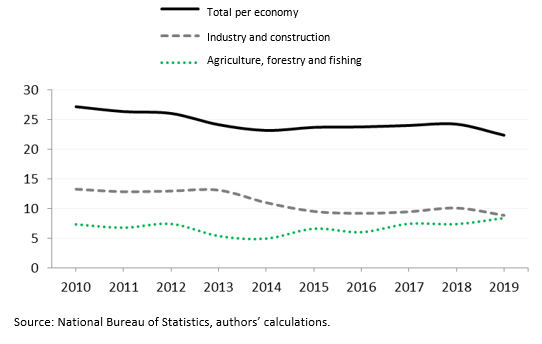
Between 2010 and 2019, GDP growth exceeded growth of final consumption of energy. These trends resulted in the growth of energy productivity and a decrease in energy intensity at the level of the entire economy (figure 22). Over 2010-19, energy intensity declined by 17.7% – from 27.2 to 22.4 grammes oil equivalent/MDL. Energy intensity registered a more pronounced decrease in the industry and construction sectors. In this sector, GVA – an indicator that reflects the production process – increased by 54.1%, while energy consumption increased by only 3.1%. As a result, energy intensity in industry and construction decreased by 33.1% – from 13.3 to 8.9 grammes of oil equivalent/MDL. At the same time, energy intensity increased in agriculture. GVA in agriculture increased by 51.3% and energy use increased by 73.2%. As a result, energy intensity in the agricultural sector increased by 14.5% from 7.4 to 8.4 grammes of oil equivalent/MDL.
Figure 22. Energy intensity, MDL (2010=1)/g oil equivalent
Indicator 2.5 Share of renewable energy in the final consumption of energy
Key message
Renewable sources of energy are alternatives to fossil fuels and help reduce GHG emissions, diversify energy supply and decrease dependence on volatile oil and gas markets. In Moldova, the supply of renewable energy increased after 2010 (although it decreased in 2019). As a result, the share of renewable energy in primary energy supply and in final consumption of energy increased. Nonetheless, the supply of renewable energy in Moldova consists mainly of biofuels and waste. This shows efforts to develop a modern sector for generating renewable energy are still at an embryonic stage.
Indicator trend
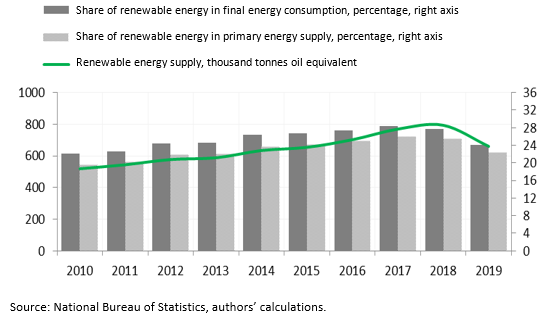
In general, the supply of renewable energy increased after 2010 (decreasing only in 2019). Between 2010 and 2018, renewable energy supply grew from 519 million to 793 million toe, an increase of 52.8%. In 2019, the supply of renewable energy dropped to 660 000 toe. Following this trend, the supply of renewable energy increased by 27.2% over 2010-19. As a result, the share of renewable energy in the supply of primary energy and in the final consumption of energy increased (figure 23). Renewable energy represented 19.7% of primary energy supply in 2010, increasing to 22.5% in 2019. During the same period, the share of renewable energy in final energy consumption increased from 22.1% to 24.1%.
Figure 23. Supply of renewable energy (thousand tonnes oil equivalent) and share of renewable energy in primary energy supply and in final consumption of energy (percentage)
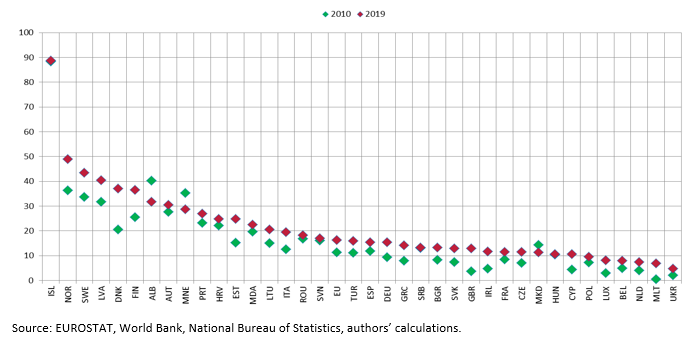
Compared with other European countries, Moldova is well positioned for renewable energy supply (figure 24). Over 2010-19, the share of renewable energy in primary energy supply in Moldova grew from 19.7% to 22.5%. The average value of this indicator in the European Union grew at a much slower rate – from 11.4% to 16.0%.
Figure 24. Share of renewable energy in primary energy supply in European countries (percentage)
Nonetheless, the share of biofuels and waste in the primary supply of renewable energy is extremely high in Moldova compared with other European countries. Biofuels and waste account for 98-99% of the primary supply of renewable energy. For its part, firewood represents over 80% of biofuels and waste. This shows that Moldova obtains most of its renewable energy from cutting trees, and that renewable energy production is at an early stage of development.
Indicator 2.6 Waste generation
Key message
Waste represents processed products or substances that cannot be used in human activities (production or consumption). Due to prolonged decomposition and the emissions generated during the decomposition, waste is an important source of environmental pollution. Two trends are registered in the Republic of Moldova (hereafter “Moldova”). Waste from enterprises has decreased, particularly after 2015. At the same time, the volume of household waste is increasing.
Indicator trend
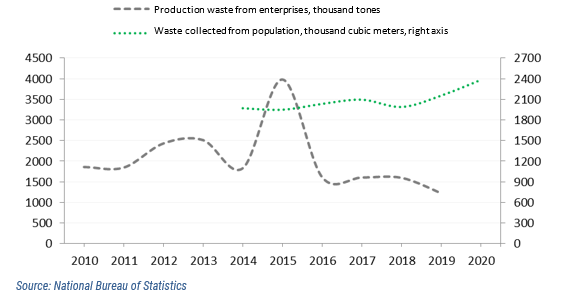
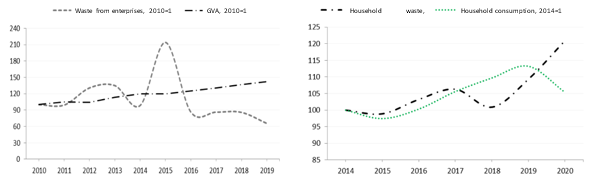
Since 2015, a clear trend is visible with respect to waste reduction from enterprises (figure 25). Between 2015-19, the amount of waste dropped by 70% (from about 4.0 million tonnes to 1.2 million tonnes). At the same time, household waste increased, especially in 2018. Between 2014 and 2018, the volume of household waste fluctuated around 2 million cubic metres (m3) before growing more intensely between 2019 and 2020. As a result, Moldova generated about 2.4 million m3 in household waste in 2020.
Figure 25. Waste generated by enterprises and households
Between 2010 and 2019, enterprises decreased their waste by more than one-third (34.3%). During the same period, GVA increased by 42.1%. Consequently, enterprises decoupled production from their waste generation. Within households, waste and consumption levels were generally the same between 2014 and 2017. Beginning in 2018, household waste grew faster than consumption (figure 26). Between 2014 and 2020, household waste grew by 20.9%, while household consumption increased by only 5.4%. Thus, Moldova continues to favour a model where waste levels surpass consumption levels.
Figure 26. Waste generated by enterprises, household waste, GVA and household consumption (percentage)
Indicator 2.7 Waste recycling
Key message
Waste utilisation means reintroducing waste in the economic circuit in the form of secondary raw materials or using them after processing as unfinished goods. Waste utilisation, including its recycling, has an important role in ensuring a healthy environment. Recycling reduces pressure on the environment because reintroducing waste in the economic circuit diminishes consumption of natural resources. Moldova uses the term “utilised waste” that comprises both recycling of waste and use of waste to produce energy. No clear trend is identified in Moldova in terms of waste utilisation.
Indicator trend
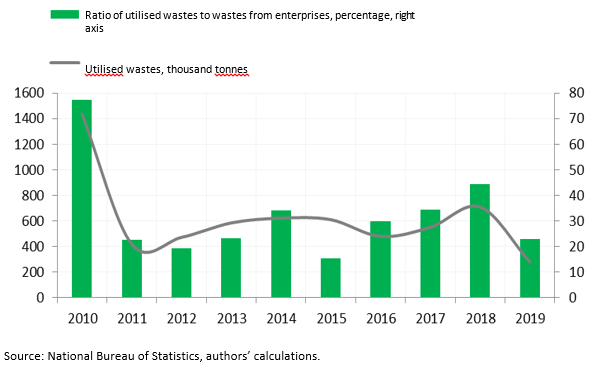
Moldova registered its biggest quantity of waste utilisation in 2010 (1.4 million tonnes). Later, between 2011 and 2019, the quantity of utilised waste varied between 300 000 and 700 000 tonnes (figure 27). At the same time, the ratio between recycled waste and waste produced by enterprises had the highest value – 77.1% in 2010. Between 2011 and 2019, this ratio varied between 19% and 44%.
Figure 27. Recycled waste, and the ratio between recycled waste and waste generated by enterprises
In the "National Waste Management Program for 2022-2027" are presented some information about the recycling rate of some categories of municipal waste. However, this information is not official data and represent only estimations of program’s authors. Thus, it was estimated that in 2018 the recycling rate of plastic waste was 4.1%, and the recycling rate was paper waste was 7.7%. A higher recycling rate is in the case of glass waste, which increased from 35.1% in 2018 to 41.5% in 2019.
Indicator 2.8 Use of fertilisers
Key message
The sustainability of agricultural systems is an important element of the green economy. In this context, progress towards green growth can be assessed by analysing the intensity of mineral fertiliser use; intense use of nitrates and phosphates can pollute the environment. In international practice, nutrient balances are calculated to estimate the pollution potential of mineral fertilisers. Moldova does not estimate nutrient balances; other information can help analyse intensity of fertiliser use. Using these indicators, Moldova has accelerated use of mineral fertilisers. However, this was not accompanied by a rapid increase in vegetal production.
Indicator trend
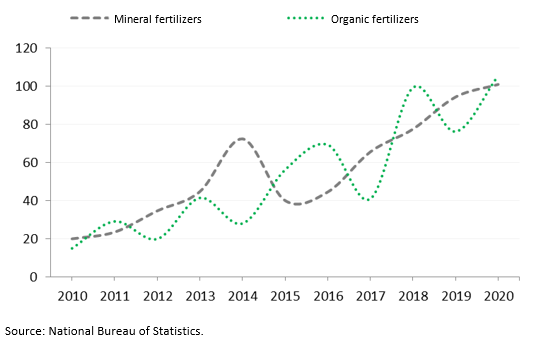
In general, use of mineral and organic fertilisers in Moldova increased after 2010 (figure 28). Between 2010-20, use of mineral fertilisers to treat land increased from 20 100 tonnes to more than 100 000 tonnes. While the trend was more erratic for organic fertilisers, there was still an increase. Between 2010-20, use of organic fertilisers on agricultural land increased from 15 100 tonnes to more than 105 000 tonnes.
Figure 28. Mineral and organic fertilisers (thousand tonnes)
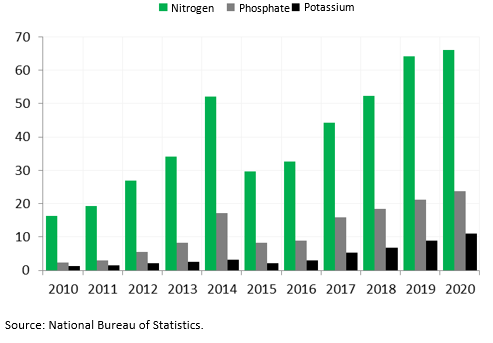
Most mineral fertilisers are nitrates followed by phosphates and then potassium. Between 2010 and 2020, use of all types of fertilisers increased rapidly. During the same period, the quantity of nitrates used quadrupled – from just over 16 000 to 66 000 tonnes. At the same time, the quantity of phosphates increased almost ten-fold – from about 2 400 tonnes to 24 000 tonnes. The use of potassium fertilisers also increased almost 8.5 times – from 1 300 to over 11 000 tonnes.
Figure 29. Minerals in fertilisers (nitrogen, phosphate and potassium)
Indicator 2.9 Use of water
Key message
Availability of water resources is a basic condition for sustainable socio-economic development. Water is vital for agricultural development and for maintaining people’s health at a satisfactory level. In addition, efficient use of limited water resources is necessary for green economic development. Water productivity can be calculated to assess the relationship between water use and economic dynamics. This indicator reveals the value of economic output (1 MDL or USD of GDP) per a certain volume of water used. For example, the growth of productivity reveals that production of 1 MDL or USD from the GDP was accompanied by less water consumption. In Moldova, water consumption has been stable since 2010, but GDP has increased. As a result, water productivity increased. Nonetheless, this growth did not allow Moldova to improve its position in relation to other European countries.
Indicator trend
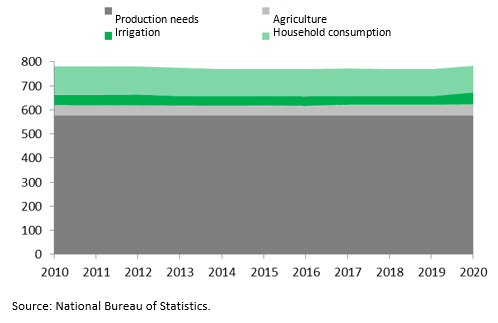
Between 2010 and 2020, water use was stable. During that period, water use remained essentially unchanged, increasing 785 million m3 to 787 million m3. Indeed, in most sectors, water use and household consumption was stable, decreasing only slightly. During this same period, Moldova used about 580 million m3 of water for production, which represents about three-quarters of water use. Meanwhile, it used 38-40 million m3 of water for agriculture and 40-50 million m3 for irrigation. Household water consumption decreased slightly, from 118 million m3 to 112 million m3.
Figure 30. Use of water by sectors (million m3)
Between 2010-20, while water use was stable, GDP increased by about 32%. As a result, water productivity increased and economic growth decoupled from water consumption. Productivity grew from USD 35.2 to 45.5 per m3 between 2010-18, an increase of 31% (with economic output expressed as PPP). Despite this progress, productivity levels in Moldova remain one of the lowest in relation to other European countries.
Figure 31. Water productivity (USD PPP (2017=1)/m3)