Group 4. The environmental dimension of quality of life
This group of indicators explores whether greening growth generates benefits for people in Moldova. The four indicators measure air pollution, population exposure to fine particulate matter, and access to safe drinking water and sewerage. Using these measurements, the chapter reflects on how environmental conditions and environmental risks interact with the quality of life and well-being of people. They also point out how the amenity services of natural capital support well-being. Further, they show the extent to which income growth is accompanied (or not) by a rise in overall well-being.
Indicator 4.1 Air pollution
Key message
Emissions of pollutants into the atmosphere are the main factor contributing to environmental pollution. Degradation of air quality has substantial economic and social consequences, such as worsening health and reduced labour productivity, which leads to a decline in quality of life. In this context, emissions levels of air pollutants are an indicator for green growth.
Emissions of air pollutants have been rising in Moldova since 2010 – a trend that amplifies risks to the environment and human health. This trend is caused by the rapid increase in emissions of pollutants from road transport.
Indicator trend
Road transport emissions have steadily risen, increasing from 146 500 tonnes to nearly 164 000 tonnes over 2010-19 (Figure 40). In 2017, emissions reached about 300 000 tonnes, their highest level since 2010. Emissions from road transport are much higher than those from stationary sources. At the same time, emissions from stationary sources have been declining since 2010. Between 2010-19, emissions from stationary sources dropped from 15 000 tonnes of pollutants to just over 14 000 tonnes.
Figure 40. Pollutant emissions into the atmosphere (thousand tonnes)

Emissions of pollutants (nitrogen oxides and sulphur oxides) in terms of the population rate show a worrying trend. Although Moldova ranks near the bottom among European states in terms of emissions of pollutants per capita, its emissions are rising rapidly. Compared with 2014, emissions per capita grew by almost 83% in Moldova in 2019, while dropping in almost all other European countries. Only Lithuania experienced a slight increase of 3.2% (Figure 41). Comparing these trends to a similar EU indicator, emissions per capita in Moldova more than doubled, increasing from 32.2% to 74.6%.
Figure 41. Atmospheric emissions of pollutants (nitrogen oxides and sulphur oxides) reported per capita

Indicator 4.2 Population exposure to fine particulate (PM 2.5)
Key message
One of the direct effects of environmental pollution is decline in human health and damage to ecosystems. Exposure to fine particulate matter (PM2.5) is an indicator of the impact of pollution on human health. PM2.5 represents solid and liquid particles suspended in the air with a diameter of fewer than 2.5 microns. In Moldova, exposure of people to PM2.5 has decreased. The country occupies an average position in relation to other European countries regarding PM2.5 exposure.
Indicator trend
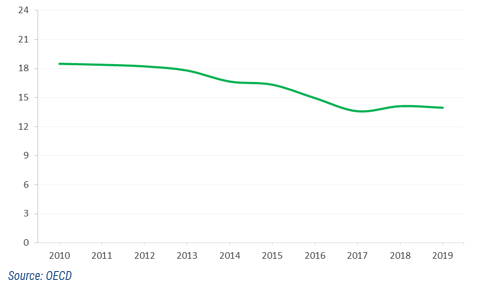
Exposure of Moldovans to PM2.5 is decreasing (Figure 42). Over 2010-19, exposure dropped from 18.5 to 14.0 microgrammes/m3.
Figure 42. Population exposure to fine particulate matter in Moldova (microgrammes/m3)
In the Republic of Moldova, the evolutions are in line with the general trend of decreasing exposure of the population to fine particulate matter in the EU. Moreover, in 2019 the Republic of Moldova had an exposure of 14 micrograms/m3, a level close to the value of the EU indicator of 13.5 micrograms /m3.
Figure 43. Population exposure to fine particulate matter (microgrammes/m3)

Indicator 4.3 Access to safe drinking water sources
Key message
People’s access to quality water is of particular importance for ensuring sustainable human development. Poor quality water affects people’s health and can lead to higher costs for economic activities. The expanding footprint of human activity means it takes more advanced and expensive treatment to ensure people have access to safe drinking water. In this context, access to safe sources of drinking water is an indicator of progress towards green growth. To quantify this dimension, the indicator shows the share of the population using safely managed drinking water services (defined as use of a nearby improved drinking water source available as needed for uncontaminated water). Moldova is rapidly expanding its public water supply network, which has increased access of people to safely managed drinking water services. However, Moldova still ranks near the bottom in relation to other European countries with respect to this indicator.
Indicator trend
Between 2010 and 2020, the public water supply system expanded quickly, and the length of sewerage networks increased by 81.4% – from just under 8 510 km to about 15 436 km. This increase was largely due to expansion of public water supply systems in rural areas. Between 2010 and 2020, the length of public water supply networks in rural communities increased 2.6 times, from about 4 046 km to nearly 10 614 km. In urban areas, expansion of public water supply networks has been much slower, increasing by only 8% – from about 4 463 km to 4 822 km (Figure 44).
Figure 44. Public water supply networks length (km)

The expansion of public water supply networks has augmented people’s access to safely managed water services. Between 2014 and 2020, the share of the population using safely managed water services increased from 72.2% to 74.1%. However, despite this progress, Moldova remains well behind other European countries in ensuring the population access to safe water sources (Figure 45). In 2020, for example, the share of the population in the European Union using safely managed water services accounted for 97.8%, which is 23.7% more than the share identified by the similar indicator in Moldova.
Figure 45. Share of population using safely managed to drink water services (percentage)

Indicator 4.4 Population connected to sewerage
Key message
Access to sewerage and sanitation services has an important role in protecting people’s health as it minimises the probability of human contact with harmful microorganisms. These services ensure the return of water through sewerage systems into water basins, which allows supply of ecosystem services to be maintained at an acceptable level. In this regard, people’s access to sewerage and sanitation services is also an aspect of transition to green economy. The share of the population using at least basic sanitation services is an indicator for use of sewerage and sanitation services. Moldova has made some progress in expanding the public sewerage network. However, the expansion of public supply networks far exceeds the increase in length of sewerage networks. This creates additional pressures on water resources, as water consumption reduces the amount of quality water returned to the natural water cycle. At the same time, even if Moldova has increased access to basic sanitation services due to an expanded public sewerage network, it ranks among the lowest in relation to other European countries in terms of this indicator.
Indicator trend
Between 2010 and 2020, the public sewerage system expanded, increasing the length of sewerage networks by 14.8% – from about 2 587 km to just over 2 970 km. This expansion was more intense in rural areas than in urban areas. Between 2010 and 2020, the length of sewerage networks in rural areas increased from 404 000 km to 563 000 km (39%). In urban areas, the length of networks increased by 10.3% – from 2 182 km to 2 407 km (Figure 46).
Figure 46. Length of public sewerage networks (km)

National authorities in Moldova focus more on the expansion of water supply systems and less on the construction of sewerage systems. Between 2010 and 2020, the length of public water supply networks increased by 6 926 km. During the same period, the length of public sewerage networks increased by only 384 km. In 2020, due to these expansions, over 2.2 million people (82.3% of the population) were connected to the public water supply system. Meanwhile, just over 1 million people benefited from the public sewerage service (40.8% of the population). At the same time, extension of the sewerage network was often not accompanied by new wastewater treatment plants. Thus, about 71% of total public sewerage systems were equipped with wastewater treatment plants in 2020. However, some wastewater treatment plants were in poor condition: 81 of 92 wastewater treatment plants were functional.
Expansion of public sewerage networks has widened people’s access to sanitation services. Between 2014 and 2020, the share of the population using at least basic sanitation services increased from 75.5% to 78.7%. However, despite this progress, Moldova still ranks among the lowest of European states with respect to this indicator (Figure 47).
Figure 47. Share of population using at least basic sanitation services (percentage)
